PROJECT CASE STUDY
Developer & Technology Survey Analysis
A Power BI analytics project exploring developer employment patterns, salaries, skills, work preferences and geographic distribution.
Project visuals
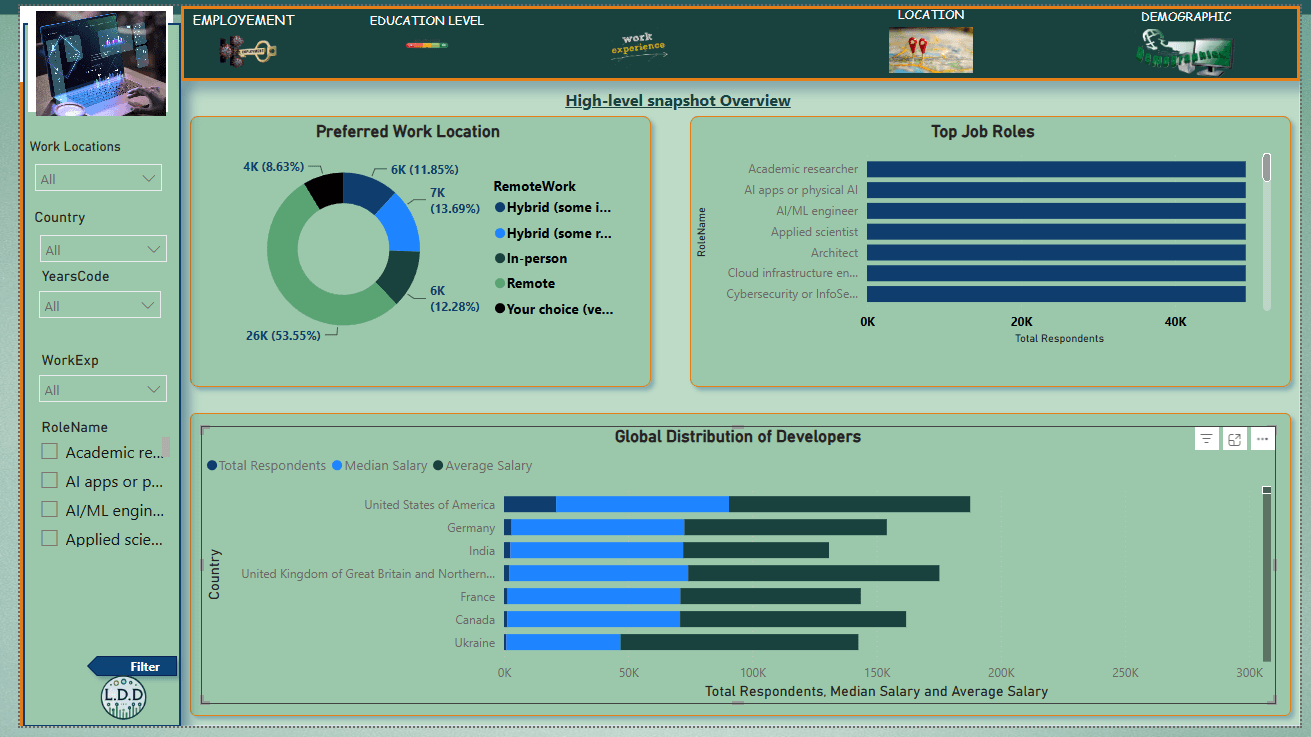
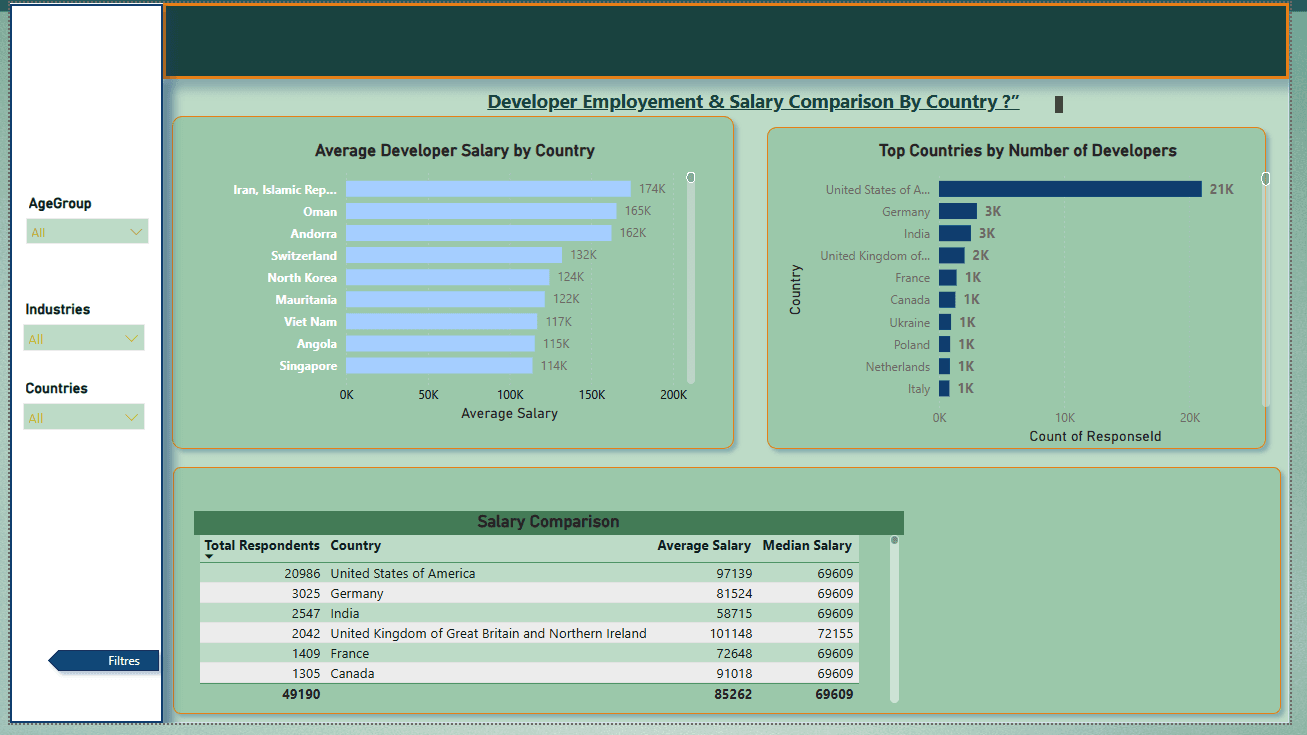
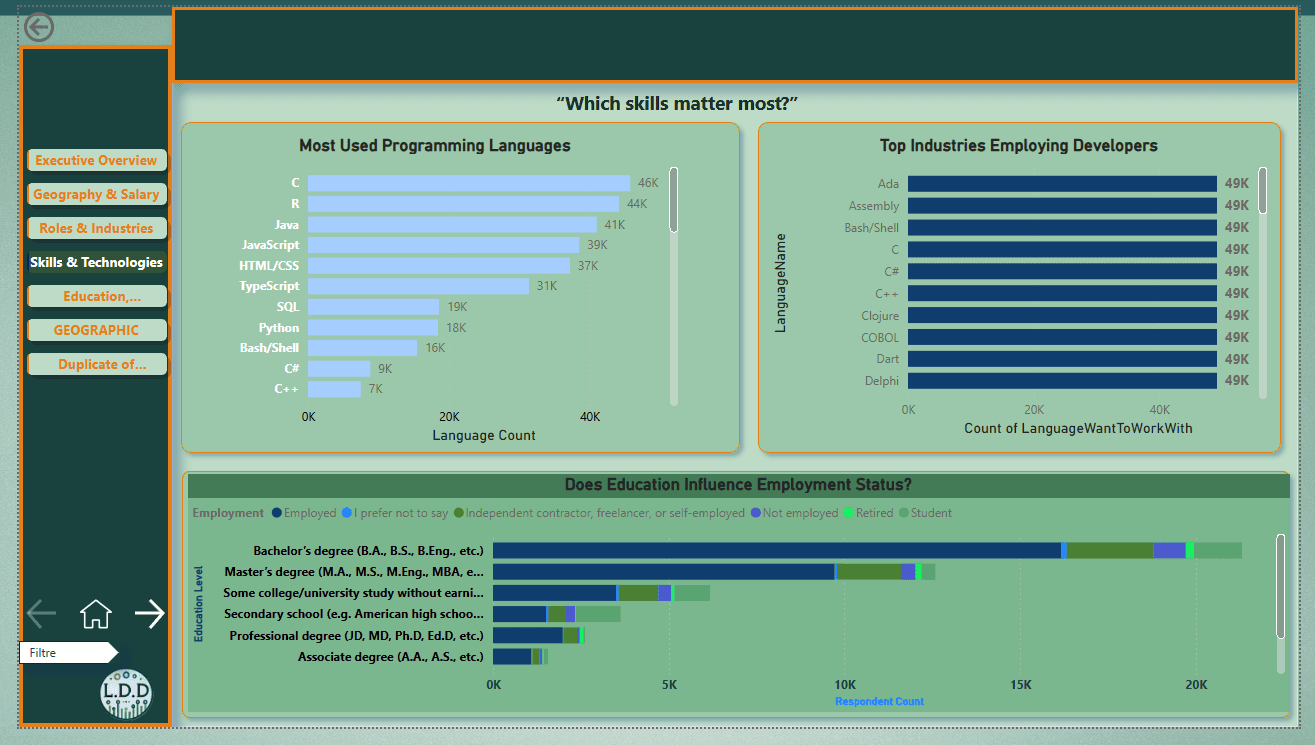
Three Power BI views cover the executive overview, geography and salary comparisons, and skills and technologies.
THE CHALLENGE
Turning a large employment dataset into useful insights
The dataset contains many variables covering employment, salary, geography, skills and work preferences. The challenge was to structure these dimensions into clear questions and useful comparisons.
THE SOLUTION
Building an interactive Power BI analysis
I prepared and explored the dataset, then used Power BI and data-analysis techniques to structure KPIs, comparisons and visual views around practical business questions.
IMPACT & LEARNING
Communicating employment and salary data clearly
The project demonstrates my ability to move from a large dataset toward structured questions, comparative analysis and clear business-oriented visual communication.